© Copyright 2020 Foshan Membrane Technology Co., Ltd. All rights reserved. Sitemap
1. Introduction
Micro/nanowires (MNWs), also referred to as micro/nanofibers, which are ultra-thin fibers drawn from glass or polymer solutions, have received wide consideration as a kind of versatile block for device construction [1]. Among the numerous optical devices and components, the optical sensors based on MNWs exhibit attractive properties, due to their high sensitivity, fast response, low power consumption, and high integration [2–4].
Nowadays, the sensory areas based on a single polymer nanowire have realized the detection of many physical quantities such as humidity and gas [5], the polymer micro/nanofiber Bragg gratings have fulfilled the strain sensing with ultra-low force detection limits [6], and the coupling structure of polymer microwire and glass microfiber is also used to sense the organic gas concentration [7]. Furthermore, by being doped or coated with different functional materials, optical waveguidings, such as functionalized polymer MNWs [3,4,8] and optical fibers [9–14], have greatly expanded the ability to generate and convert light, attracting increasing attention for optical sensing. For example, using the changing in the fluorescent intensity or spectra of a single polymer MNW doped with dye molecules, the compact humidity sensing [15] and the high-precision distribution temperature measurement [16] have been realized respectively. Coated with nanoparticles, a taper-in-taper structure sensing probes could realize the alanine aminotransferase detection and possess the potential to diagnose the liver injury [9]. These
sensors based on single waveguidings as the sensitive unit possess a simple structure and are readily for high integration, which provides an excellent platform for the miniaturization of the device. However, most of the reported MNW sensors are also facing the challenge of errors in the optical signals such as intensity and spectrum, which leads to instability of the MNW sensors in practical application [2,8,17].
To eliminate the interference of environmental and background noise on the optical signal, the fluorescence lifetime has become the analysis object of the microfiber coated with fluorescent nanoparticles. Fitted by the Fast Fourier transform (FFT), the lifetime-based temperature sensor proposed by Yang et al could provide higher stability and faster response [18]. Meanwhile, by analyzing the radiation pattern of the silica microfiber from the images captured by a camera, the microfiber sensor exhibits a potential for sensing the environment with a refractive index higher than the microfiber [19]. Therefore, the optical information extracted by various data analysis technologies from different aspects may provide new ideas for the development of the MNW optical sensors. Recently, in MNW doped with dye molecules, the energy distribution in the waveguide has been observed according to the fluorescence indication and directly recorded by a camera [20,21]. The optical property of the coupled-MNW structure during the energy modulation could be depicted by the fluorescent path in real-time [21,22]. The fluorescence in the rare earth ions doped polymer film is also used to assist in imaging the leaky radiation of the tapered optical fiber for direct observation of the acceleration of light [23]. The fluorescence-indicating method provides a facile and intuitive approach to visualizing and analyzing signals in MNF devices.
In this paper, a visualized concentration sensor based on a single Rhodamine B (RhB)-doped polymer microwire (PMW) has been proposed. Through the waveguide excitation method, the fluorescence of the RhB-doped PMW surrounded by the solution is excited and used to indicate the periodic distribution of the energy of the waveguiding. The visible fluorescent period length varies with the concentration of the solution, and the response relationship between the average fluorescent period and the liquid concentration is obtained. The visualized sensor based on fluorescence indication could operate stably in saline solution (NaCl and KCl) and sucrose solution, revealing the good stability and adaptability of visualized concentration detection in various solutions.
The dye-doped PMW used in our study was fabricated from the poly (methyl methacrylate) (PMMA) solution. The organic solution was obtained by dissolving 1.0 g PMMA and 3.0 mg RhB into 6 g of chloroform. The direct drawing technique was employed to fabricate the doped PMWs, which is described in Refs. [24,25] in detail. The fabrication procedure of the single RhB-doped PMW used in our experiments is illustrated in Section 1 in Supplement 1. As-fabricated RhB-doped PMW has excellent uniformity and smoothness, which could be seen in Fig. S2 in Supplement 1.
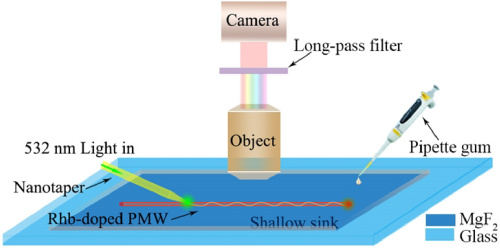
As illustrated in Fig. 1, we deposited a straight RhB-doped PMW on a MgF2 substrate under the 50× objective of an optical microscope (80i, Nikon). Considering that the magnification of the eyepiece is 10×, the optical microscope can magnify the observation object by 500 times. A 532-nm-wavelength laser (MR.GL.T1.532.30-OEM, Shanghai MRTRADE) was used as a light source and launched into a nanotaper which was drawn from a standard single-mode optical fiber by the flame-heated method [26]. The diameter of the nanotaper could be smaller than 1 µm. The preparation of the nanotaper and its typtical dimensions are described in Section 3 in Supplementary Information. Through the nanotaper, the fluorescence in the doped PMW is excited by the waveguiding excitation method [25]. The optical microimages of the light-emitting RhB-doped PMWs were recorded by the sCMOS camera (Neos, frame rate: 96 fps for 2560 × 2160 pixels, Andor) through a long-pass filter (G-2A, Nikon), which was mounted on the microscope.

(Fig. 1. Schematic illustration of fluorescent excitation in RhB-doped PMW by waveguiding coupling approach.
The concentrations of the aqueous solution, such as sodium chloride (NaCl), potassium chloride (KCl), and sucrose (SUC) solutions, are the sensing targets in our study. We firstly dissolved 1.0 g of solute into 49 g of pure water to reach the initial concentration of 2.0%. The liquid covered the whole doped PMW when we dropwise added the solution by a pipette gun. The concentration could be varied back and forth from 2.0% to 3.0% by stepwise addition of a higher concentration solution or pure water.
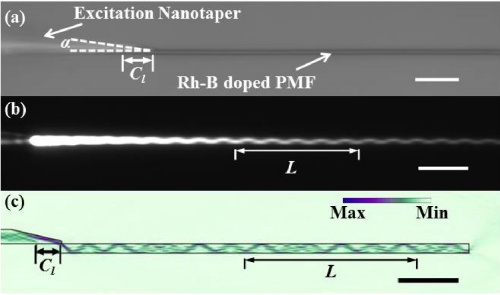
Experimentally, the typical waveguiding excitation for the RhB-doped PMW is shown in Fig. 2. A nanotaper-coupled PMW was firstly adjusted to the best coupling condition in the air [27]. According to Fig. 2(a), the coupling condition could be measured in the bright-field microimage, that is the coupling length (Cl) is ∼4.01 µm and the coupling angle (α) is 13.0°. The clearest periodic oscillation could be found in the 1.56-µm-diameter RhB-doped PMW by comparing the microimages taken from the RhB-doped PMWs with different diameters (Section 4 in Supplement 1). We chose the doped PMW with a diameter of 1.56 µm as the optimal for our experiments.

(Fig. 2. Fluorescent excitation in RhB-doped PMW placed in the air by waveguiding coupling approach. (a) Experimental bright-field optical microimage; α=13.0°, d = 1.56 µm, and the coupling length between nanotaper and doped PMW is 4.01 µm. (b) Dark-field optical microimage with the long-pass filter corresponding to (a). (c) Simulated energy distribution: Cl = 4.2 µm and α=13.0°. Scale bars for all are 10 µm.)
Figure 2(b) is the dark-field optical microimage corresponding to Fig. 2(a). When the 532-nm-light propagated in the doped PMW, the fluorescence was excited along the PMW. The wavelength range of fluorescence after passing through the filter was 590 nm to 620 nm (G-2A, Nikon). The filter is used to filter out the scattering of excited light and make the fluorescent path more clear. The comparsion of the optical microimages taken with and without the filter could be found in Section 5 in Supplement 1. According to the indication of the fluorescence, the energy oscillation inside the waveguide was observed in the area which is away from the coupling point. The periodic optical path in the RhB-doped PMW is formed due to the multimode interference of light waves in the waveguide [20]. When the coupling condition is constant, the period of the fluorescent path in the doped PMW is mainly affected by the refractive index of the environment [20,27]. The length of five continuous periods was defined as the fluorescence optical path length (L) in the microwire. Consequently, the average oscillating period (Δ) in the microwire was one-fifth of L.
Figure 2(c) is the simulated energy distribution when a PMW was coupled to the nanotaper in the air. The coupling condition was set according to the experiment in Fig. 2(a) (Cl = 4.2 µm and α=13.0°) and the diameter of the PMMA microwire (d) was 1.56 µm. A periodically oscillating light path formed in the microwire when the 600-nm-wavelength light traveled along the waveguiding. The simulated L was ∼26.2 µm, which was close to the measured value (∼25.75 µm in Fig. 2(b)).
To directly exhibit the fluorescent period dependence on solution concentration, we compare the fluorescent paths of the 1.56-µm-diameter RhB-doped PMW in the NaCl solutions with different concentrations. The RhB-doped PMW coupled with the nanotaper was used as the sensory area to perceive the environmental changes. The NaCl solution was added to the sensing area until the liquid covered the entire doped PMW.
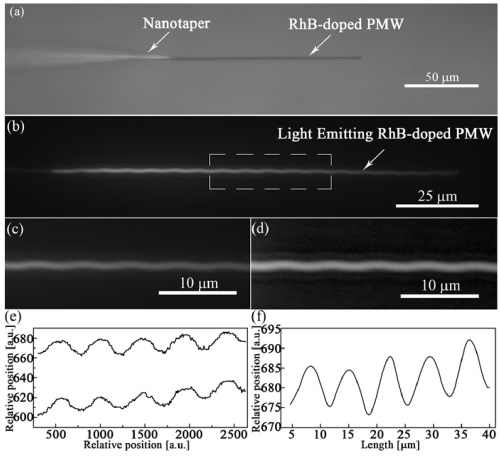
Figure 3(a) shows the optical bright-field image of the doped PMW in the air. The coupling condition of the nanotaper and doped PMW was fixed with Cl = 4.05 µm and α=13.6°. Under the same coupling condition, when the PMW was in the NaCl solution with a concentration of 2.0%, the incident light propagated along the microwire and the fluorescence was excited with obvious oscillation, which could be observed in Fig. 3(b). Through the long-pass filter, the bright light belt appears along the microwire, indicating that the fluorescence in the doped PMW could be effectively excited. Considering the 96-fps frame rate of our camera, it is about 0.01 s for one-image capture. Therefore, when a camera is used for signal recording, the information captured in the image could directly reflect the current environment which has the potential to provide the real-time situation. We select the segment far from the coupling area, which is marked by the white dashed box, to measure the length of five continuous fluorescent periods (L) and further calculate the single fluorescent period (Δ).

(Fig. 3. (a) Original bright-field microimage of the RhB-doped PMW. (b) The corresponding dark-field microimage of (a) when the RhB-doped PMW was immersed in NaCl solution with a concentration of 2.0%. (c) Enlarged original image of the dashed rectangle of (b). (d) Enhanced dark-field image corresponding to (c) after image processing. (e) Extraction of the fluorescent light path from (d). (f) Peak extraction after smoothing the fluorescent path contour of the doped PMF.)
Figure 3(c) is the original dark-field microimage of the light-emitting PMW in the NaCl solution, which is corresponding to the dashed rectangle of Fig. 3(b). It could be found that compared with the optical path in the doped PMW surround by air (Fig. 2(b)), the one deposited in the solution is blurred. To increase the clarity of the fluorescence path in the doped PMW, we performed image processing for Fig. 3(c). The process of image processing and analysis is carried out on the MATLAB software platform. After Fourier-transformed and enhanced by the histogram equalization method, the enhanced dark-field optical microimage is shown in Fig. 3(d). The brightness and clarity of the processed underwater images have been significantly improved. The image evaluation methods and evaluation indexes could be found in Tab. S1, Section 6, in Supplement 1.
To accurately measure L, a MATLAB program is used to read the fluorescent period of the doped PMW. Firstly, we use the “imcontour” function to extract the outline of the fluorescent optical path. The outline of the extracted fluorescent path is shown in Fig. 3(e). Obvious periodicity of the profile could be found. Since the two outlines are consistent with each other, we chose the upper outline for subsequent analysis of the periodic reading. The profile of the fluorescent path was smoothed by the “spcrv” function and the length of 5 continuous fluorescent periods (L) was read by the “findpeaks” function, and the result is shown in Fig. 3(f). The L which was measured according to Fig. 3(f) was ∼35.4 µm. The single oscillating period (Δ) in the doped PMW immersed in 2.0% NaCl solution was one-five of L, which was 7.08 µm. To accurately obtain
the value of period from the optical image, we chose five different segments from the image, analyzed each segment following the procedure above and calculated the average value and standard deviation. Therefore, the period in Fig. 3 is 7.073 ± 0.015 µm.
Meanwhile, the same processing was performed on the optical microimage of the same doped PMW which is in the air (Fig. 2(b)). The value of L in the RhB-doped PMW in Fig. 2(b) was 25.7 µm and the corresponding Δ in the air was 5.15 µm. After five-time measurements, the period is 5.14 ± 0.013 µm in air. The fluorescent period was significantly smaller than that of the 2.0% NaCl solution. This is mainly due to the different refractive indexes of the environments, which affect the interference of light in the microwire [20,28,29].
When the RhB-doped PMW was immersed in the solutions with different NaCl concentrations, the changing fluorescent period could be observed and measured. Figure 4 shows the simulated and experimental results of a 1.56-µm-diameter RhB-doped PMW in the NaCl solutions with three concentrations. The coupling condition is Cl = 4.05 µm and α=13.6°. To be consistent with our experimental conditions, we measured the refractive
index of the NaCl solutions with the refractometer which are 1.3359, 1.3367, and 1.3379 corresponding to 2.0%, 2.57%, and 3.0% NaCl solutions respectively, and used them for the simulation calculation by COMSOL. We enlarged the dashed part in Fig. 4(b) for further image analysis. The enlarged optical microimages captured from different solutions were enhanced according to the procedure described in Fig. S6 in Supplement 1. The processed images are shown in Fig. 4(d), (f), and (h) corresponding to the concentration of 2.0%, 2.57%, and 3.0%, respectively. The evaluations of the processed microimages are shown in Tab. S2, Section 6 in Supplement 1.